Description
The client, a research center studying medicine quality, has a database where they input data from their watch on publications related to medicine quality. They needed to produce graphs on specific medicine for a research article.
Technologies
Extraction of data from MySQL database.
Charts creation with R.
What did I do?
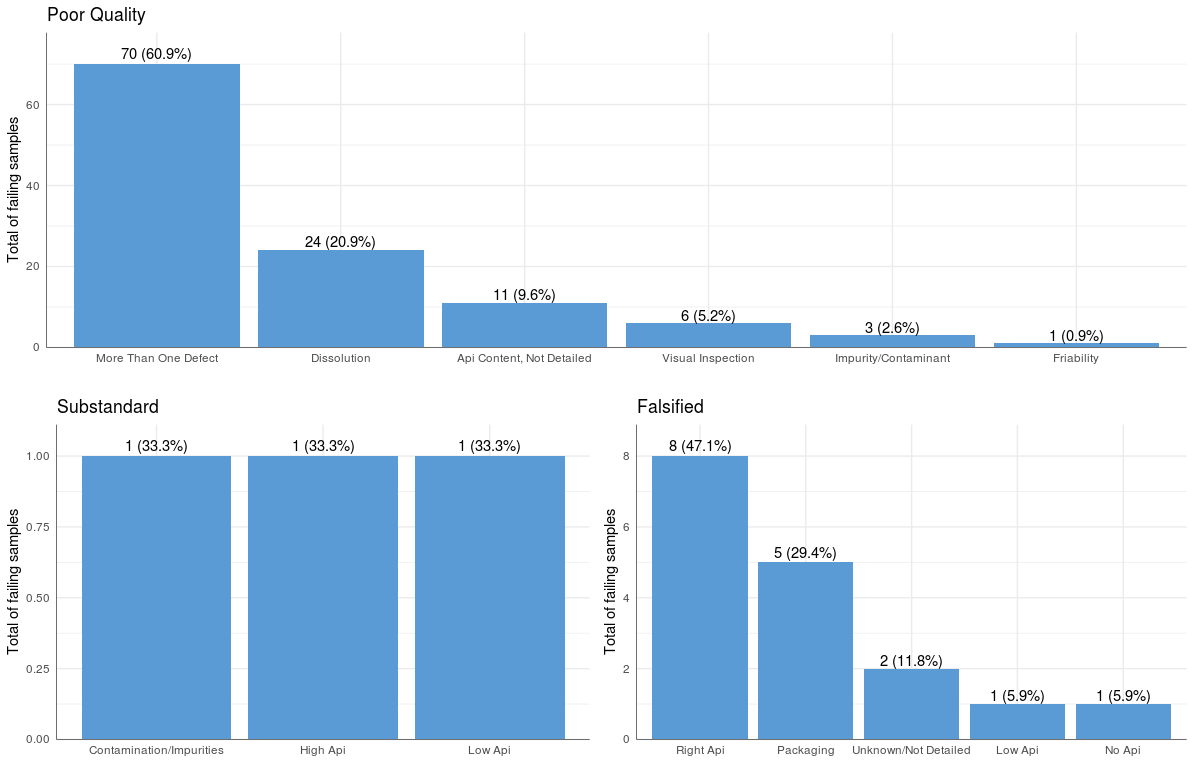
I had to understand the structure of the database and then write the SQL requests corresponding to the graphs they wanted to create.
From those requests, I used R to generate graphs.
Period
November 2018

How can I help?
Whether you already know about your data pain points or just want to have a friendly conversation, send me a message.
